Follow the instructions given below to access the Dashboard in CDP.
The Dashboard page typically loads automatically after you log in. See Logging in to CDP Server.
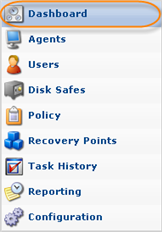
To access the Dashboard from any other screen, click on "Dashboard" in the main menu.
| Tip You can access the Dashboard by typing the Server IP in the browser address bar. For example: http://10.61.200.31/, https://localhost, http://localhost:8080. |
The Dashboard can contain the following elements:
- Getting Started Area - Provides access to the major functions of the system.
- Main Menu Panes - Provides access to the major functions of the system.
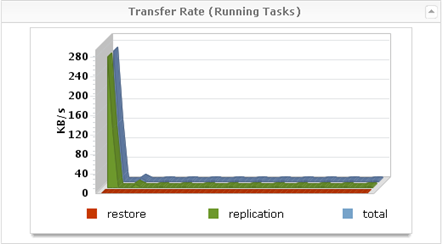
- Transfer Rate (Running Tasks) Widget - Provides the details of running Tasks.
- Running and Queued Tasks Widget - Provides the details of queued Tasks.
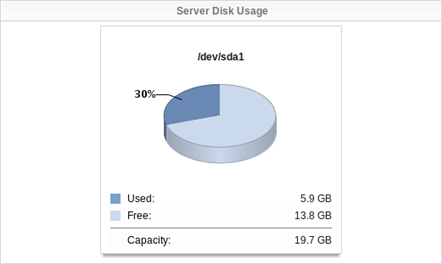
- Disk Usage Widget - Provides information about used and free space, and the capacity for each Device.
- Policies Widget - Provides information about Policy states.
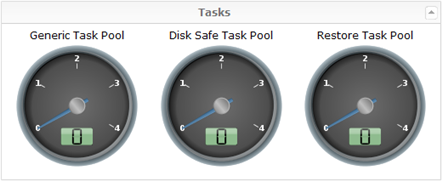
- Tasks Widget - Provides information about the Generic Task Pool, Disk Safe Task Pool, and Restore Task Pool.
- Throughput Gauges:
- Replication Throughout - Shows current bytes/s totaled for all running tasks.
- Bare-Metal Restore Throughput - Shows current bytes/s totaled for all running BMRs.
- File Restore Throughput - Shows current bytes/s totaled for all running file restores.
Getting Started Area
For beginners, the links to the main actions are displayed in the Dashboard:
- Create a Disk Safe - See Creating Disk Safes.
- Define a Data Protection Policy - See Creating Policies.
- Wait for Initial Replica - See Accessing Task History.
- Enjoy CDP Replication
Transfer Rate (Running Tasks) Widget
The Running Tasks widget is visible to all Users. It is a scrolling list of currently running tasks.
With the help of the Running Tasks widget, Users can perform the following operations:
- Open task details
- Cancel tasks
Running and Queued Tasks Widget
The Queued Tasks widget is visible to all Users. It is a scrolling list of currently queued tasks.
With the help of the Queued Tasks widget, Users can perform the following operations:
- Open task details
- Cancel tasks
Disk Usage Widget
The Disk Usage Widget is visible only to Super Users. It shows the current disk usage and refreshes every 5 seconds.
Policies Widget
The Policies Widget shows the current states of Policies.
It displays each type of Policy status as an icon. All possible states are listed in the following table.
 |
Indicates the Policies that are not OK. |
 |
Indicates the Policies that have warnings. |
 |
Indicates the Policies that are OK. |
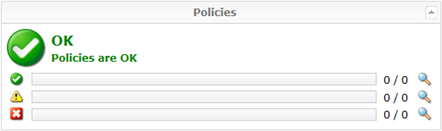
Click on the "Detail" icon to go to the Policies list, which is sorted according Policy state.
If one or more Policy runs with errors, the "Error" icon is displayed.
Tasks Widget
Provides information about the Generic Task Pool, Disk Safe Task Pool, and Restore Task Pool.