The Data Center Console Dashboard allows you to monitor the statistics of all the CDP Servers connected to the Console.
Follow the instructions below to access the Data Center Console Dashboard.
1. The Dashboard page typically loads automatically after you log in. See Logging in to CDP Data Center Console.
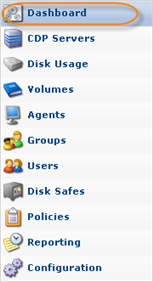
To access the Dashboard from any other screen, click on "Dashboard" in the main menu.
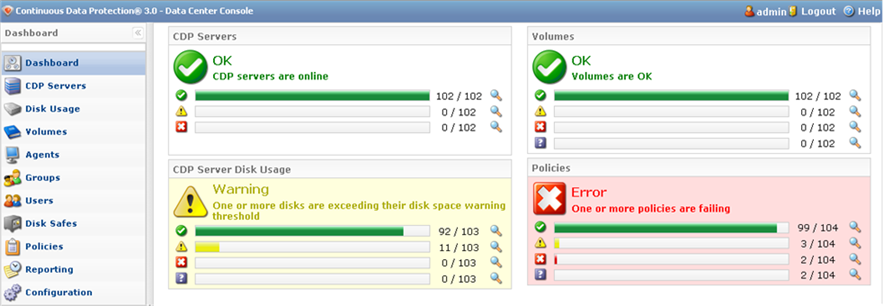
2. The Dashboard screen contains four information panes:
- CDP Servers - Displays the status of CDP Servers connected to the Console. The following notifications are available:

The number of online CDP Servers 
The number of CDP Servers currently not responding to queries 
The number of offline CDP Servers To access more detailed information about the servers, click the
 icon. This will take you to the "CDP Servers" screen.
Note
When you switch to the "CDP Servers" screen, the filter is automatically applied to the Servers list depending on the notification you have selected.
- CDP Server Disk Usage - Displays the status of Disks (Devices that are assigned to the Disk Safes) from all the CDP Servers connected to the Console. The following notifications are available:
The number of Disks that have enough free space The number of Disks that are exceeding their disk space warning threshold The number of Disks that have reached their disk space limit 
The number of Disks that are currently in an unknown state To access more detailed information about the disks, click the
icon. This will take you to the "Disk Usage" screen.Note
When you switch to the "Disk Usage" screen, the filter is automatically applied to the disks list depending on the notification you have selected.
- Volumes - Displays the status of Volumes from all the CDP Servers connected to the Console. The following notifications are available:
The number of Volumes that have enough free space. The number of Volumes over soft quota. See Creating Volumes for more information about quotas The number of Volumes at a hard quota. See Creating Volumes for more information about quotas The number of Volumes currently in an unknown state To access more detailed information about the volumes, click the
icon. This will take you to the Data Center Console "Volumes" screen.Note
When you switch to the "Volumes" screen, the filter is automatically applied to the volumes list depending on the notification you have selected.
- Policies - Displays the status of Policies, that are enabled on all the CDP Servers connected to the Console. Disabled policies are not displayed. The following notifications are available:
The number of Policies that have completed successfully The number of Policies that have completed with alerts The number of Policies that have failed to complete The number of Policies that are in unknown state
To access more detailed information about the policies, click the icon. The icon will take you to the Data Center Console "Policies" screen.
| Note When you switch to the "Policies" screen, the filter is automatically applied to the Policies list depending on the notification you have selected. |
| Tip You can change the position of the windows by using drag-and-drop. 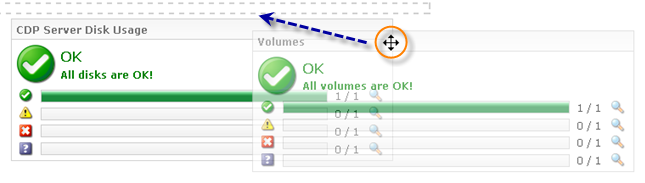 |