Follow the instructions below to access the Task History screen via the CDP Interface.
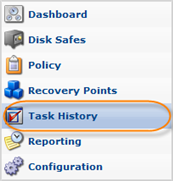
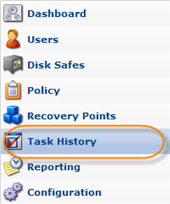
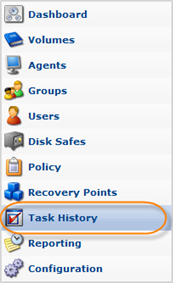
Click on Task History in the Main Menu to open the Task History screen.
| Standard Edition | Advanced Edition | Enterprise Edition |
|---|---|---|
 |
 |
 |
| Tip You can access the Task History screen by manually appending the /TaskHistory/ folder to the CDP Server address in the browser address bar. Example: http://10.61.200.31/TaskHistory/. Note that the address is case sensitive. 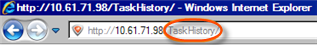 |
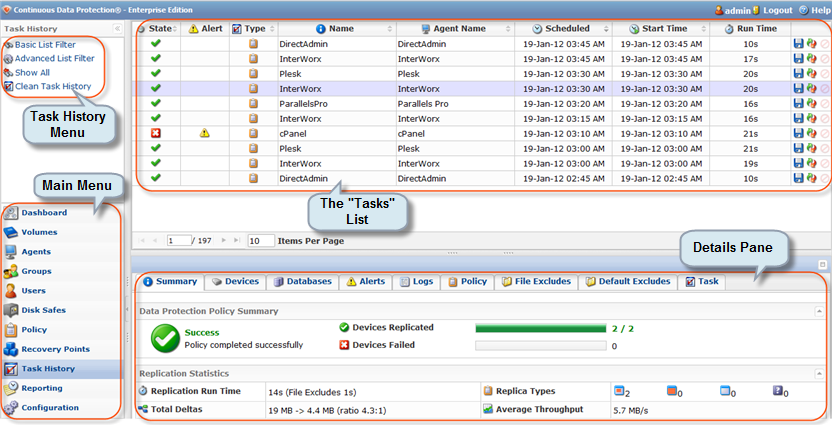
The Task History screen is divided into the following areas:
- Task History Menu - Provides access to the actions related to customizing the Task History list.
- Task History List - The running and finished Tasks are listed here.
- Details Pane - After you select an item in the list, its details are displayed in this area.
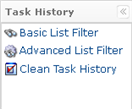
Task History Menu
The following Task History menu buttons are available:
- Basic List Filter - Allows you to customize the view of the Task History list by applying any of the minimum (most commonly used) filter criteria. See Customizing the Task History List.
- Advanced List Filter - Allows you to customize the view of the Task History list by applying any of all possible filter criteria. See Customizing the Task History List.
- Clean Task History - Allows to shedule the Task History Clean-up.
The Task History List
The Task History list provides information about running and completed Tasks in a grid format.
| Tip You may organize information such as filtering out the items you do not need to see. You can also sort items, limit the number of items displayed per page and specify which columns you want to display. See Customizing the Task History List. |
| Tip To find out the name of a column heading, hover the mouse pointer over the column heading, without clicking it. The title will be displayed in a yellow tooltip.  |
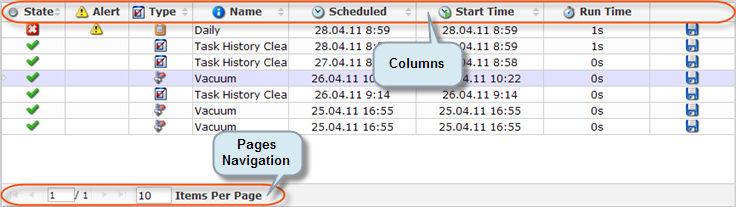
Columns:
- State - Graphically indicates the Task state: Queued, Running, Finished, Error, Canceled or Duplicate.
- Finished - Indicates that a task has completed successfully.
- Running - Indicates that a task is currently running.
- Queued - Indicates that a task is queued, waiting to be run.
- Cancelled - Indicates that a task was cancelled.
- Error - Indicates that the task has completed with errors.
- Duplicate - Indicates that the task was a duplicate of a running task.
- Alert - Graphically indicates if an Alert was generated while the Task was running.
- Type - Graphically indicates Task type: Restore Files, Merge Recovery Points, Data Protection Policy, Vacuum, Data Base Restore or Bare-Metal Restore.
- Data Protection Policy - Indicates the task was a Data Protection Policy Task.
- File Restore Task - Indicates the task was a File Restore Task.
- Merge Recovery Points - Indicates the task was a Merge Recovery Points Task.
- Vacuum - Indicates the task was a Vaccuum Task.
- Database Restore - Indicates the task was a Database Restore Task.
- Bare Metal Restore - Indicates the task was a Bare Metal Restore Task.
- Email Reporting - Indicates the task was an Email Reporting Task.
- Archive - Indicates the task was an Archive Task.
- Delete Archive Points - Indicates the task was a Delete Archive Points Task.
- Stream Control Panel Users Archive - Indicates the task was a Stream Control Panel Users Task.
- Task History Clean Up - Indicates the task was a Task History Clean-up Task.
- Name - For Data Protection Policies, the name specified in the Policy properties is shown in this column.
- Agent Name (Enterprise Edition) - Shows the name of the Agent.
- Agen Host Name/IP (Enterprise Edition) - Shows the IP address of the Agent.
- Scheduled - Date and time when a Task was scheduled.
- Start Time - Date and time when a Task was started.
- End Time - For finished Tasks, the field displays the date and time when a Task was finished. For running Tasks, the field is empty.
- Run Time - Duration of a Task. For example, 45m 17s. For running Tasks, the field changes and displays the time that has passed after the Task start.
- Actions - Provides access to actions available for the Task.
- Download Task Details - Allows you to save the task details on your PC.
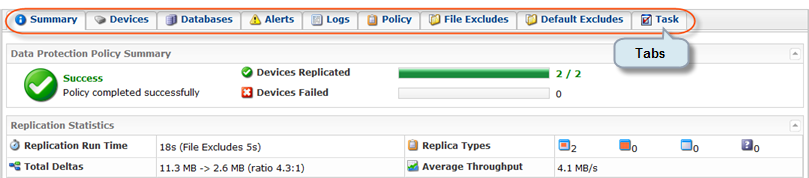
Details Pane
This area provides detailed information about the Task selected in the list. The data is presented in tabs. The following information is available:
- Summary - Accumulates general information about the Task including verbose status and data shown in the "Task History" list. For running Tasks, the status bar and remaining time are supplied. There is also data about Task Performance. See Viewing Task Summary.
- Devices - Shows the list of assigned Devices.
- Alerts - Contains Alerts occurred during Task run. See Viewing Alerts.
- Logs - Shows logs messages received from the CDP Server and Agent. See Viewing Log Messages.
- Policy - This tab is visible if the Task type is "Data Protection Policy." Shows information about the Policy.
- File Excludes - This tab is visible if the Task type is "Data Protection Policy." Shows the list of the files excluded from the replication.
- Default Excludes - This tab is visible if the Task type is "Data Protection Policy." Shows the list of the files and folders excluded from the replication by default.
- Merged Recovery Points - This tab is visible if the Task type is "Data Protection Policy" or "Merge Recovery Points." Shows the list of the merged Recovery Points. See more in Merging Recovery Points.
- Tasks - Shows details about selected Task.
Each tab contains a number of blocks.
| Tip The Task results can be sent via email as a Report. See Reporting. |
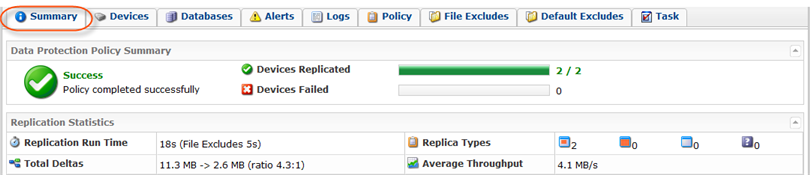
Summary
- Data Protection Policy Summary - Indicates whether replication policy is completed successfully or with alerts. Shows the number of replicated and failed devices.
- Statistics:
- Replication Run Time - Indicates total amount of replication performance time in hours, minutes, and seconds. Time needed for File Excludes is shown in brackets.
- Total Deltas - Shows the ratio of received/not received Deltas.
- Replica Types - Details on replica types: CDP replication, Block Scan, Initial Replica, Unknown Replica Type.
- Average Throughput - Average throughput of the replica Task.
Devices
- State - Graphically indicates replica Task state. If the icon is green, then the Task assigned to device is complete. If the icon is red, then the device is not mounted.
- Mount Point - In Unix-like systems, a mount point is the location in the operating system's directory structure where a mounted file system appears. For example, many modern Linux distributions automatically mount the CD drive as /media/cdrom so that the contents of the CD drive will appear in the /media/cdrom directory. The equivalent to mounting in Microsoft Windows is known as mapping a drive. Since Windows 2000, NTFS devices can also be mounted to empty NTFS folders.
- Device Path - Hardware address of the Device.
- Progress - Bar that displays the progress of the Task.
- Type - The type of replica performed within the device.
- Run Time - Total time in minutes and seconds of the running Task.
- Deltas - Size of received deltas in megabytes.
- Size - Compressed size in megabytes.
- Speed - The speed of the Task that is being performed.
- Throughput - The average throughput of the device.
- Network - The average network rate.
- Disk Usage - Shows percentage of disk usage and the ratio of used and free space.
- Actions:
- Details - Opens new window with replication details for the device.

Databases
- Name - The name of the database.
- Type - The type of the database.
- Start Time
- Time Elapsed

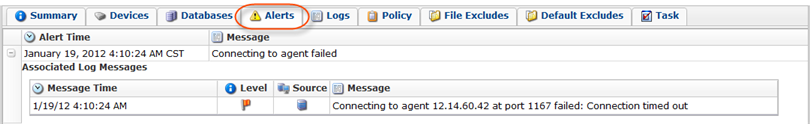
Alerts
- Alert Time - Shows the exact date and time when the alert occurred.
- Message - The content of alert message in brief.
- Associated Log Messages:
- Message Time - The date and time of the received message.
- Level - Indicates the level of alert: Warn, Error, Info.
- Source - Shows the location source of a trouble.
- Message - The content of alert message in brief.
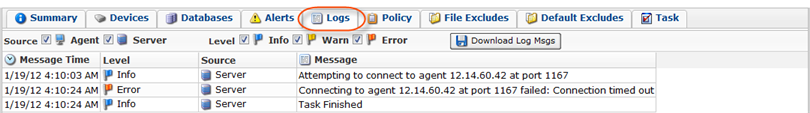
Logs
- Message Time - The date and time of the received message.
- Level - The current state of the Task. A Task can be on one of the following levels: Info - A message logged for information purposes only; Error - An error message; Warning - A warning message.
- Source - Shows the location source of a trouble.
- Message - The text of a Log Message.
| Tip You can select the checkboxes to show or hide the columns: 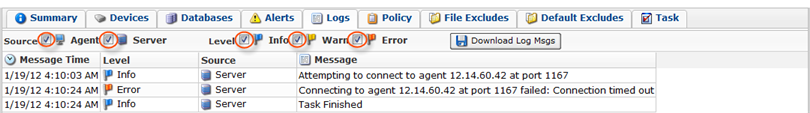 |
| Tip To save Log Messages on your local PC, press the button "Download Log Msgs": 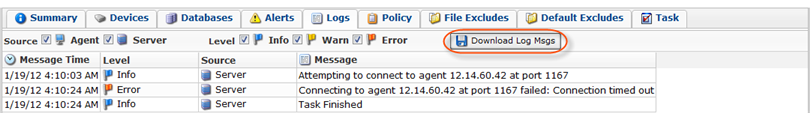 |
| Note The alerts and errors that occur during the Policy run are saved in Log Files. See [CDP3:Log Files]. |
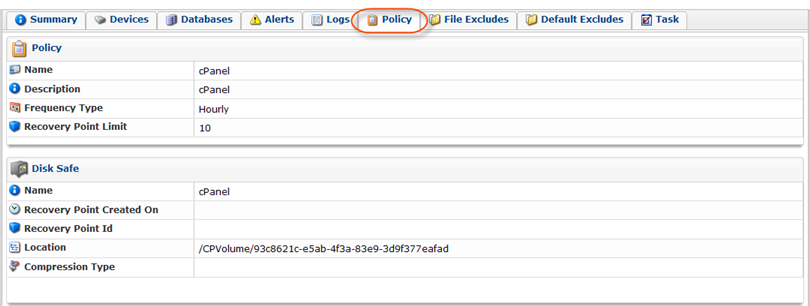
Policy
- Policy:
- Name - The unique name of the Policy.
- Description - Additional information about the Policy. This field is also unique.
- Frequency Type - Recurrence selected for running the Policy (On Demand, Minutely, Hourly, Daily, Weekly, Monthly, or Yearly).
- Recovery Point Limit - Indicates how many Recovery Points will be kept. The old Recovery Points will be merged automatically.
- Disk Safe:
- Name - Shows Disk Safe names. The name is defined during Disk Safe creation and can be edited later. It is used to identify the Disk Safe in the list.
- Recovery Point Created On - Shows the exact day and time when the Recovery Point was created.
- Recovery Point Id - Identification number generated by the system.
- Location - The location address of the Disk Safe.
- Compression Type - The type of compression used for the Disk Safe.
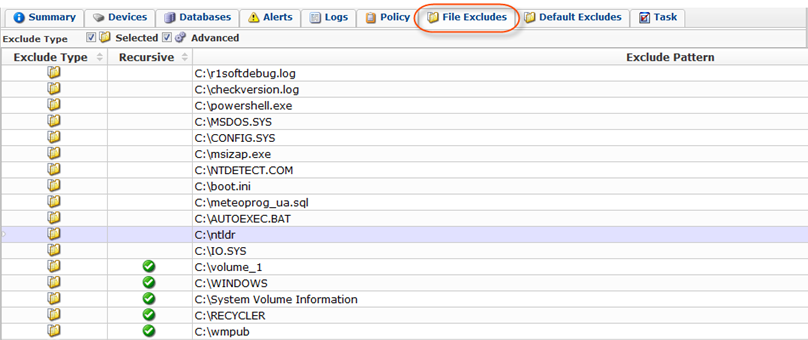
File Excludes
- Exclude Type - Selected or Advanced exclude type is possible.
- Recursive - Indicates whether the excluded file is recursive or not. If the icon is green, the recursion is possible.
- Exclude Pattern - Shows the physical location of the excluded file.
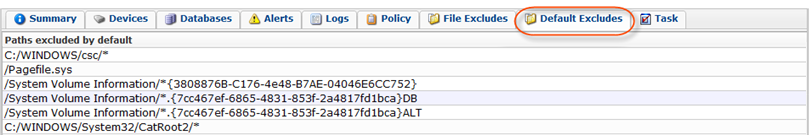
Default Excludes
- Paths excluded by default - Shows the file or folder paths excluded by default.
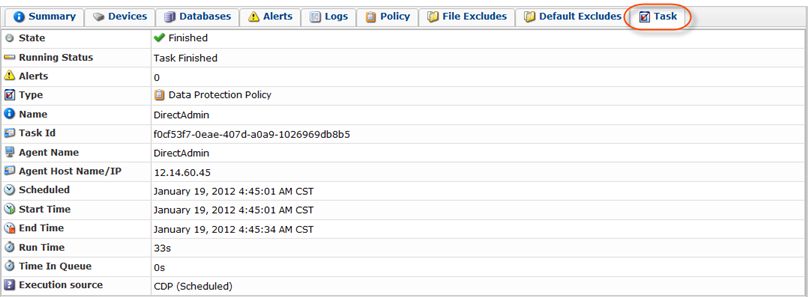
Task
- State - The state of Task completeness: Finished, Error.
- Running Status - Indicates whether the Task is finished or not.
- Alerts - Shows the number of alerts while the Task is being performed.
- Type - Shows the type of replica Task.
- Name - Name of the Task.
- Task Id - Identification number generated by the system.
- Agent Name (Enterprise Edition) - The name of the Agent.
- Agent Host Name/IP (Enterprise Edition)- The host name or IP address of the Agent.
- Scheduled - The exact date and time when the Task was previously scheduled.
- Start Time - The exact date and time of the Task start time.
- End Time - The exact date and time of the Task end time.
- Run Time - The time in minutes and seconds used for Task completion.
- Time in Queue - The waiting time while the Task is performing.
- Execution Source(Enterprise Edition)
| Tip You can collapse/expand the details of a block by clicking on the header of the corresponding block. |
Labels: