Follow the instructions below to access the Dashboard in CDP.
The Dashboard page typically loads automatically after you log in. See Logging in to CDP Server.
To access the Dashboard from any other screen, click on "Dashboard" in the main menu.

| Tip You can access the Dashboard by typing the Server IP, the root folder in the browser address bar. For example: http://10.61.200.31/, https://localhost, http://localhost:8080. 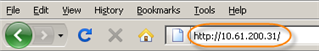 |
After you log in to CDP for the first time after installation, you see that the "Dashboard" has an additional "Getting Started" area. 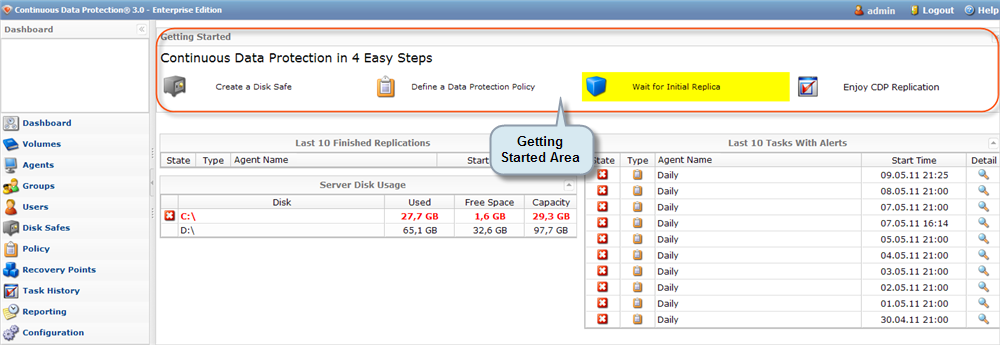
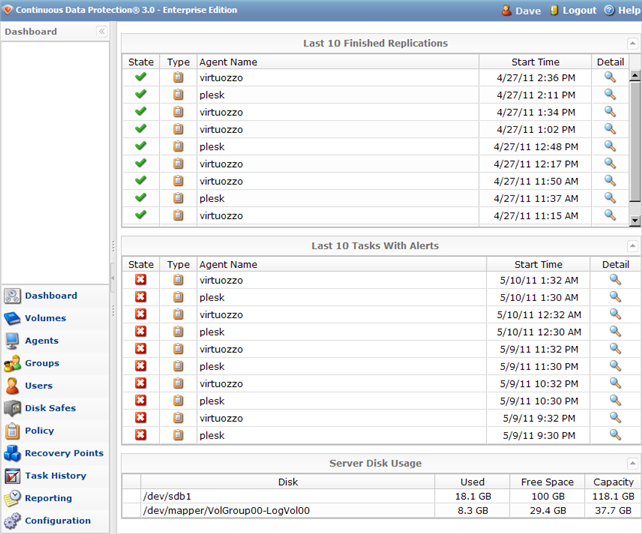
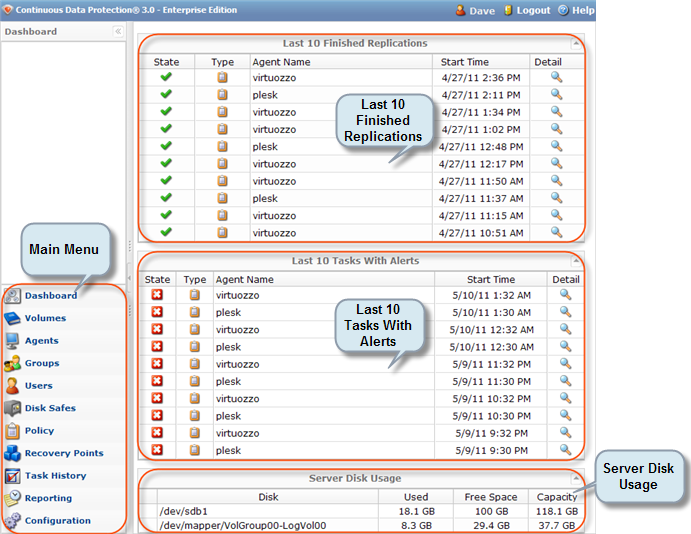
The Dashboard can contain the following panes:
- Main Menu - Provides access to the major functions of the system.
- Last 10 Finished Replications - Provides details of ten recently finished Policies. You can access their summary.
- Last 10 Tasks with Alerts - Provides details of ten recently finished Tasks with alerts. You can see the alerts in detail.
- Disk Server Usage - Provides information about used and free space, and capacity for each Device.

Tips - You can change the location of the panes by using drag-and-drop.
- You can expand/collapse the pane details by clicking on the arrow button in the top right corner of the header of the pane.
- You can change the location of the panes by using drag-and-drop.
Getting Started Area
For beginners, the links to the main actions are displayed in the Dashboard:
- Create a Disk Safe - See Creating Disk Safes.
- Define a Data Protection Policy - See Creating Policies.
- Wait for Initial Replica - See Accessing Task History.
- Enjoy CDP Replication
After clicking on the link, you will go directly to the appropriate screen.
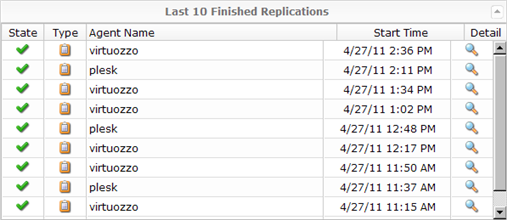
Last 10 Finished Replications
The table displays information about 10 recently finished Policies. The table includes the following columns:
- State - Graphically indicates the current State of the Task. The state can change over time. Move the mouse pointer over it to display a yellow tool tip that informs you of what the icon indicates. A Task can be in one (1) of the following states:
- Queued - The Task is waiting and will run as soon as more resources are available.
- Running - The Task is currently in progress.
- Finished - The Task has completed successfully and without errors.
- Error - The Task has completed with one or more errors.
- Canceled - The Task has been terminated by the User on the "Reporting" page while running.
- Duplicate - There is a duplicate scheduled Task in the queue.
- Type - Graphically indicates Task type: Restore Files, Merge Recovery Points or Data Protection Policy. Move the mouse pointer over it to display a yellow tool tip that informs you of what the icon indicates.
- Agent Name
- Start Time - Date and time when a Task was started.
- Detail - By clicking on the icon located in the "Detail" column, you can open the "Summary" window for the Task. The same information as shown on the "Summary" tab in the "Reporting" screen is provided in the opened window. See descriptions in Viewing Task Summary.
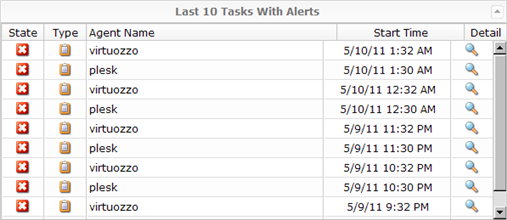
Last 10 Tasks with Alerts
The table displays information about 10 recent Tasks with alerts. Columns are the same as in "Last 10 Finished Replications."
By clicking on the icon located in the "Detail" column, you can open the "Alerts" window for the Task. The same information as shown on the "Alerts" tab in the "Reporting" screen is provided in the opened window. See descriptions in Viewing Alerts.
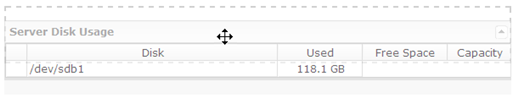
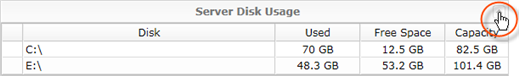
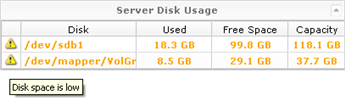
Server Disk Usage
- Alert - Move the mouse pointer over it to display a yellow tool tip that shows you the message. For example, "Disk space limit has been reached".
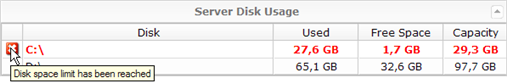
- Disk- Disk name. See Devices.
- Used - Disk Resources occupied by data, in megabytes and gigabytes.
- Free Space - Disk Resources not occupied by data, in megabytes and gigabytes.
- Capacity - The capacity of a Disk to hold and retain data.
If Disk Usage reaches a warn level, the Server Disk Usage area changes its color. See more in Configuring Server Options for configuration of the option "Warn When Disk Usage Exceeds".
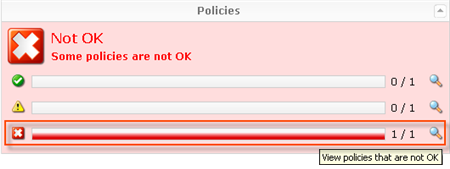
Policy Errors
If Policies run with errors, the Policy Errors table is displayed on the Dashboard.
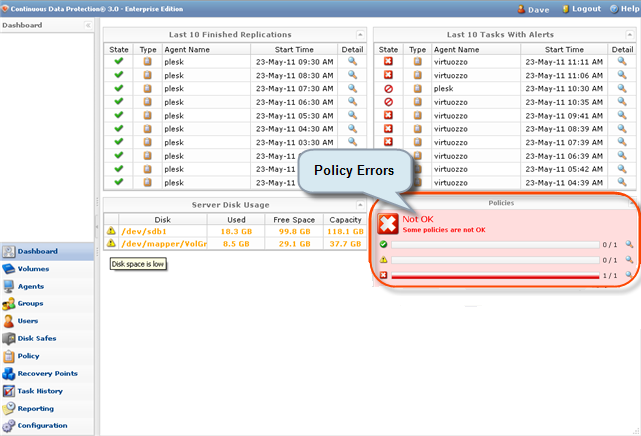
Click on the Details icon ![]() to access the Policies screen.
to access the Policies screen.
The green icon indicates the Policies that run without errors.
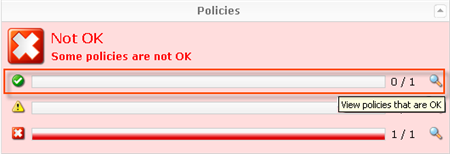
The yellow icon indicates the Policies that have warnings while processing.
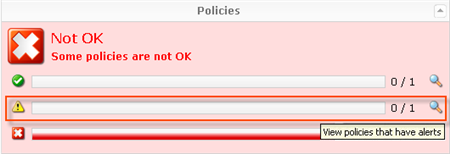
The red icon indicates the Policies that run with errors.