Follow the instructions given below to access the Dashboard in the Backup Manager.
The Dashboard page typically loads automatically after you log in. See Log in to Backup Manager.
| Note If this is the first time you are logging in to the Backup Manager after installation, follow the instructions in Activate Server Backup Manager. |
To access the Dashboard from any other screen, in the Main menu, click Dashboard.
| Tip You can access the Dashboard by typing the Server IP in the browser address bar. For example: http://10.61.200.31/, https://localhost, http://localhost:8080. |
The following window will appear:

The "Dashboard" contains the following elements:
- Main Menu Panes - Provides access to the major functions of the system.
- Servers & Policies - Provides access to Servers and Policies.
- Storage - Provides information about used and free space, and the capacity for each Device. It also shows the percentage of deduplicated files.
- Restores - Provides information about Restores.
- Trial Time Left - Provides information on how many days of the Trial Period are left. It also shows the number of used and remaining physical and virtual Servers.
- Activity - Provides information on tasks currently being performed.
- Performance - Provides information on the average duration and number of backups. Also shows a real-time task's chart if it is currently being performed.
| Note The layout can be changed by using one of the three buttons located in the upper right corner of the Backup Manager window.
|

| Note You can also change the location of any widget by dragging and dropping it.
|

Servers & Policies
The "Servers & Policies" widget is visible for all users. It shows the number of added Servers and the number of Policies with different states.
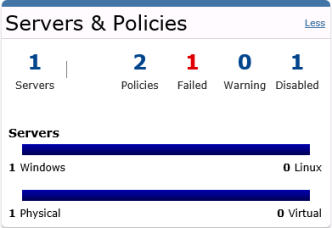
With the help of this widget, users can access the information related to Servers and Policies.
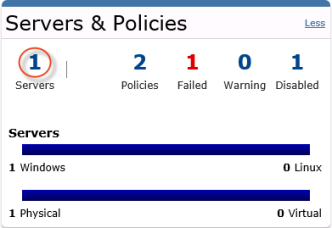
| Note These numbers function as links. For example, you can click the "Servers" link to access the Servers list. See more in Access servers.
|
You can also click the following links to access information concerning Policies:
- Policies - Lists all available Policies. See more in Access policies.
- Failed - Lists only Policies with any errors that occurred during the backup process. See also View log messages and Access log files.
- Warning - Lists only Policies with any warnings that occurred during the backup process. See also View log messages and Access log files.
- Disabled - Lists only Policies that were disabled manually. See more in Disable policies.
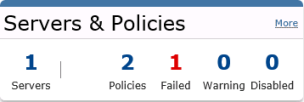
| Note You can collapse the "Servers & Policies" widget by clicking the "Less" link in the upper right corner.
As a result, you will see the following:
|

The "Servers" area provides the following information:
- Windows - The number of added Windows Servers.
- Linux - The number of added Linux Servers.
- Physical - Shows how many Servers are physical among all the available Servers.
- Virtual - Shows how many Servers are virtual among all the available Servers.
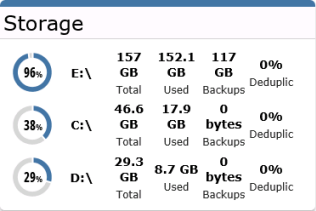
Storage
The "Storage" widget is visible only to Super Users. It provides the following information:
- Total - The total capacity of the disk.
- Used - The space used by various data.
- Backups - The space occupied by backups.
- Deduplicate - The space saved by the deduplication procedure, which, if enabled, performs during every backup process. This feature is enabled during Disk Safe creation. For more information, see Create Disk Safes.
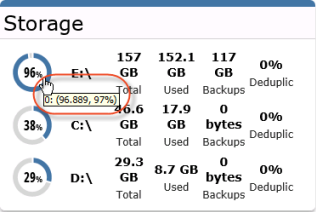
| Note You can also hover the mouse pointer the circle to see additional information about disk usage in percentages.
|
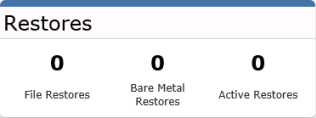
Restores
The "Restores" widget is visible only to Super Users. It provides the following information:
- File Restores - Shows the number of File Restore tasks that have been performed. It also includes tasks that ended with errors.
- Bare-Metal Restores - Shows the number of Bare-Metal Restore tasks that have been performed. It also includes tasks that ended with errors.
- Active Restores - Shows the currently running Restore tasks.
Trial Time Left
The "Trial Time Left" widget is visible only to Super Users. It provides the following information:
- Days Left - Shows how many days are left to use the Backup Manager in the 14-day trial period. Once the trial period ends, you won't be able to use the program. See Activate Server Backup Manager.
- License Now - Use this button to activate your Backup manager or purchase a license.
- Physical Servers - Shows how many physical Servers are used and how many Servers are available to be added according to your license limitations.
- Virtual Servers - Shows how many virtual Servers are used and how many Servers are available to be added according to your license limitations.
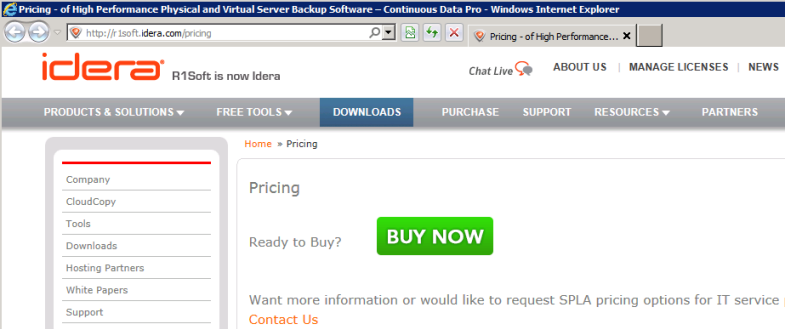
- Buy More - Use this link to purchase a license.

| Note You can collapse the "Trial Time Left" widget by clicking the "Less" link in the upper right corner.
As a result, you will see the following:
|


| Note After clicking the "Buy More" link, you will be redirected to the official R1Soft site.
|
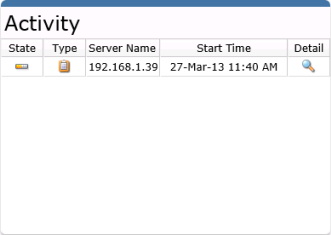
Activity
The "Activity" widget is visible for all users. You can see the list of active tasks here. The following columns are presented:
- State - The current state of the task. For example, it can be "Running."
- Type - The task's type. The following types are available:
- Data Protection Policy - Shown if a Data Protection task was started. See Run policies.
- Restore Files - Shown if a Restore Files task was started. See Restore files.
- Archive Recovery Points - Shown if an Archive Recovery Points task was started. See Run archive policies.
- Merge Recovery Points - Shown if a Merge Recovery Points task was started. See Merge recovery points.
- Disk Safe Verification - Shown if a Disk Safe Verification task was started. See Run Disk Safe verification.
- Bare-Metal Restore - Shown if a Bare-Metal Restore task was started. See Launching Bare-Metal Restore.
- Vacuum - Shown if a Vacuum task was started. See Vacuum Disk Safes.
- Task History Clean Up - Shown if a Task History Clean-up task was started. See Manage task history.
- Restore Control Panel User Data - Shown if a Restore Control Panel User Data task was started. See Download control panel user data as an archive and Send control panel account backup to Control Panel Home for end-users.
- Reporting - Shown if a Reporting task was started. See Generate reports.
- Database Restore - Shown if a Database Restore task was started. See Restore SQL Server and Restore MySQL.
- Exchange Restore - Shown if an Exchange Restore task was started. See Restore Microsoft Exchange.
- Server Name - The name of the Server that is currently backing up.
- Start Time - The date and time of the task's start.
- Detail - Click this icon to see the details of this task. You can also see this task in the Task History. See Access task history.
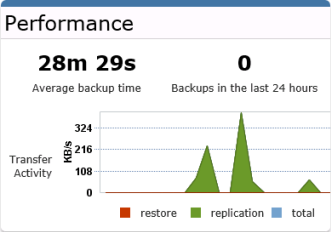
Performance
The "Performance" widget is visible only to Super Users. Provides the following information:
- Average backup time - Shows the average calculated time of a backup procedure.
- Backups in the last 24 hours - Shows the number of backups performed during the last 24 hours.
- Transfer Activity - Shows a real-time task's chart. The following chart colors are available:
- Green - For replication procedures.
- Brown - For Restore procedures.
- Blue - For a total view.