The Dashboard page is the first thing you see when you log in to Server Backup Manager (SBM). The information displayed on this page allows you to perform core tasks directly from the Dashboard as soon as you sign in to SBM. The widgets in the center of the Dashboard page provide an at-a-glance review of monitor real-time SBM statistics, such as local backup and restore performance, disk usage, status of protected machines, and CPU/memory. An Activity monitor on the right side of the page allows for real-time monitoring of running tasks, such as backups, merges, and archives. All SBM tasks and functions are intuitively grouped in the Main Menu on the left side of the page for fast navigation and quicker performance.
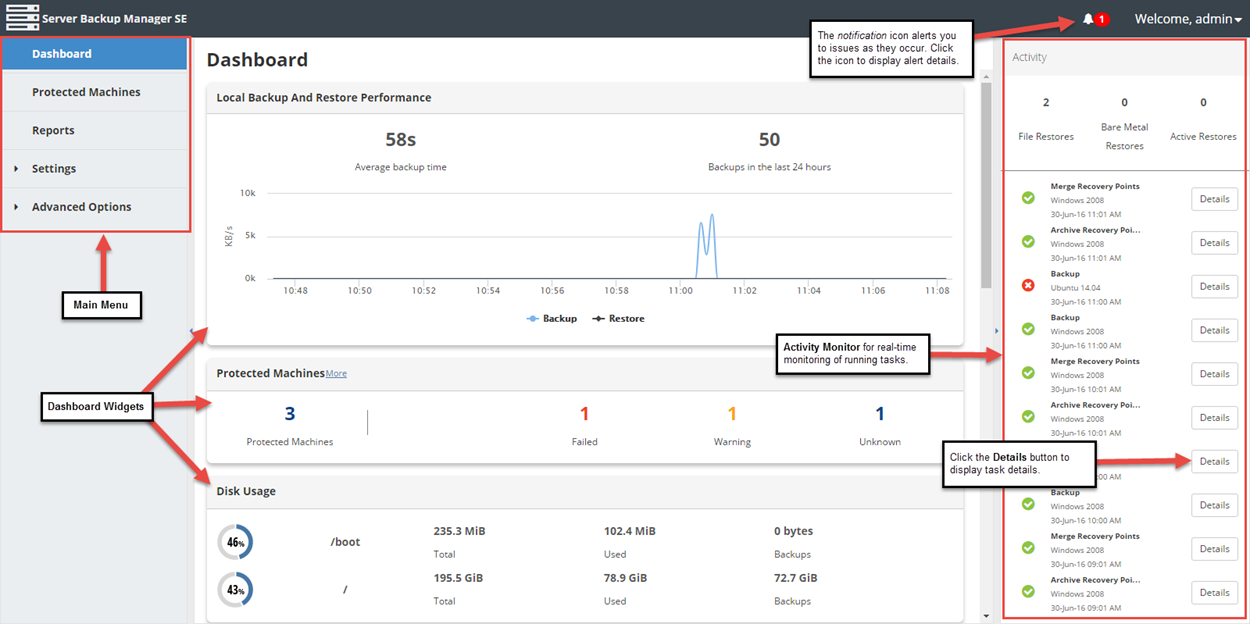
Main Menu
The Main Menu displays throughout the Server Backup Manager. The following links are available in the Main Menu:
- Dashboard. Return to the Dashboard from any page.
- Protected Machines. Displays the Protected Machines page, where a new machine can be added and an existing machine can be maintained.
- Reports. Displays the Reports page, where a new report can be added and an existing report can be maintained.
- Settings. Click here to display the following links:
- Volumes. Displays the Volumes page, where a a new volume can be added and an existing volume can be imported or maintained.
- Users. Displays the Users page, where a new user can be added and existing user profiles can be maintained.
- Disk Safes. Displays the Disk Safes page, where a new Disk Safe can be added, an existing Disk Safe can be maintained, or a Disk Safe can be attached.
- Policies. Displays the Policies page, where a new policy can be added and existing policies can be maintained.
- Advanced Options. Click here to display the Manager Information page and the following menu options:
- Manager Options.
- Language Settings.
- Task Scheduler.
- Web Server Options.
- API Server Options.
- Database Drivers.
- Manager Information.
- License Information.
- Product Features.
- LDAP Authentication.
- Remote Replication Options.
Widgets
The widgets that display in the main Dashboard section can be easily customized if needed. For example, you can change the order in which the widgets display by simply dragging and dropping the desired widget to a new location. You can also click the Widgets drop-down menu above the Widgets section to decide which widgets should display on the Dashboard screen.

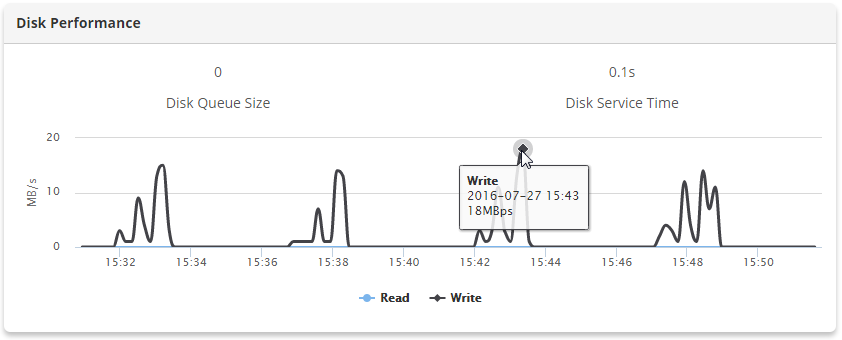
Disk Performance
The Disk Performance widget is only available for super-users. It displays information on the disk queue size and disk service time, as well as a real-time task chart displaying the megabytes per second of the tasks being performed.
CPU and Memory
This widget displays the total number of CPUs and total physical memory. A real-time graph displays the percentage of CPU compared to the percentage of total memory. The average CPU load, cache, and free swap space also displays.

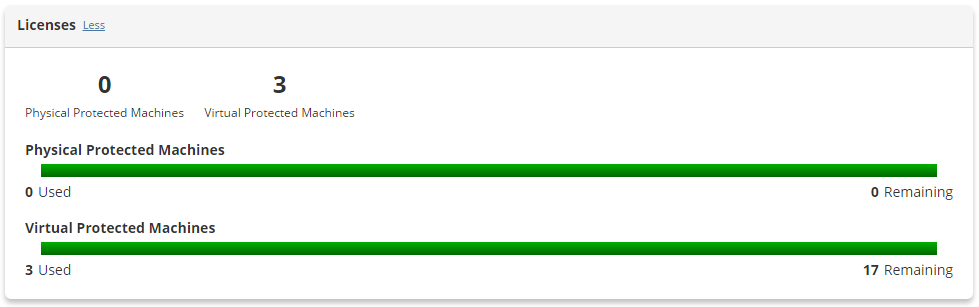
Licenses
This widget displays the total licenses used and remaining for physical and virtual protected machines.
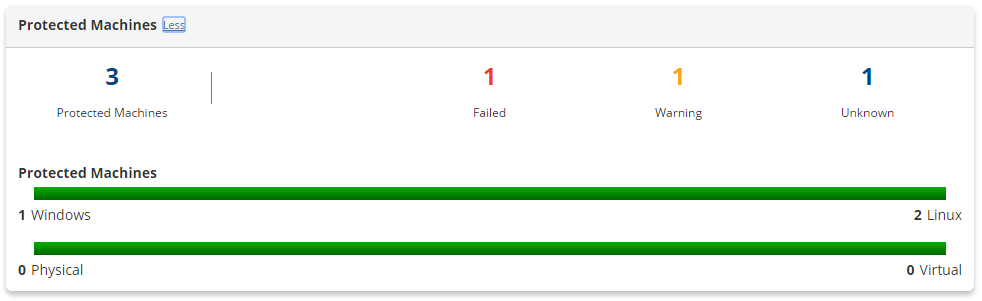
Protected Machines & Policies
The Protected Machines widget, visible for all users, displays the total number of protected machines and their status.
Local Backup and Restore Performance
This widget displays the average backup time and number of backups in the last 24 hours. The graph in this widget displays the total backup kilobytes per second (KB/s) compared to the total restore KB/s.

Disk Usage
The Disk Usage widget displays information about used and free space and the capacity for each device. The percentage of deduplicated files may also display, if enabled. This widget is only available for super-users.
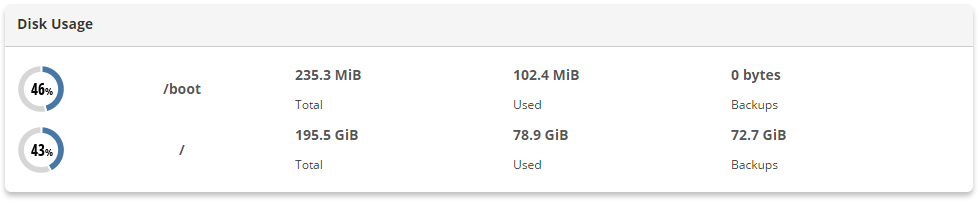
The following columns display in this widget:
- Available Disk. This column displays the percentage of disk available for storage.
- Disk Name. This column displays the name of the disk.
- Total. This column displays the total capacity of the disk.
- Used. This column displays the space used on the disk by various data.
- Backups. This column displays the space on the disk occupied by backups.
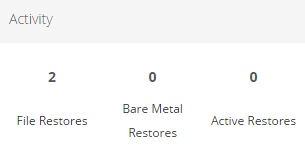
Activity
The Activity section on the right side of the Dashboard displays real-time status updates of tasks that have been performed, such as merges and backups. A green check displays next to a successful task; a red X displays next to a task that did not complete properly. The following task types can display in this section:
- Data Protection Policy. For more information, see Run policies.
- Restore Files. For more information, see Restore files.
- Archive [Backup|Merge|Download]. For more information, see Offsite Backup and Archival .
- Merge Recovery Points. For more information, see Merge recovery points.
- Disk Safe Verification. For more information, see Run Disk Safe verification.
- Bare-Metal Restore. For more information, see Launch a bare-metal restore.
- Vacuum. For more information, see Vacuum Disk Safes.
- Task History Clean Up. For more information, see Task History.
- Restore Control Panel User Data. For more information, see Download control panel user data as an archive and Send control panel account backup to Control Panel Home for end-users.
- Reporting. For more information, see Generate reports.
- Database Restore. For more information, see Restore SQL Server and Restore MySQL.
- Exchange Restore. For more information, see Restore Microsoft Exchange.
The top of the Activity section displays the status of Restore tasks. The first number represents the number of File Restore tasks that have been performed, including tasks that ended in errors. The second number represents the number of Bare-Metal Restore tasks performed, including tasks that ended with errors. The third number is the number of Restore tasks that are currently running.
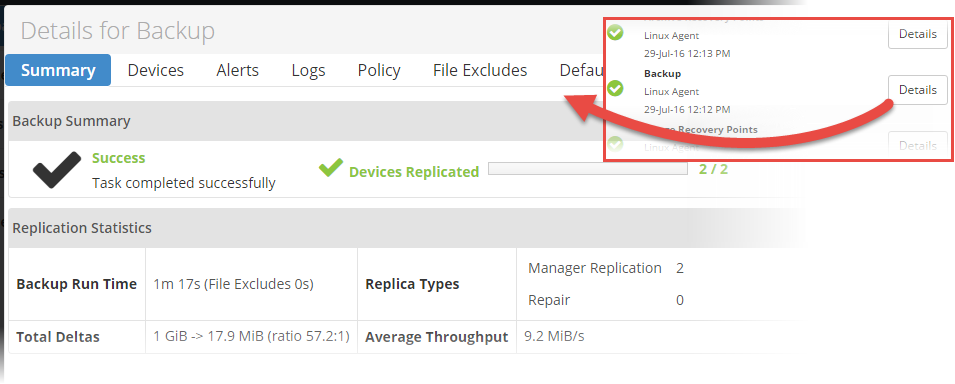
Each active task displays the type of task running, the name of the machine, and the date and time that the task was started. In the following screenshot, a Backup task ran on the "Linux Agent" machine on July 29, 2016 at 12:12 p.m.
To display the details of a specific task, simply click the corresponding Details button. For example, click the Details button for a Backup task to display the Details for Backup window, where a summary of the task, device information, file excludes, and more can be reviewed.